
This article was written by Hafsteinn Einarsson. Hafsteinn is a PhD student in the social statistics department at the University of Manchester. Before starting his PhD, Hafsteinn worked for several years as a survey project manager in Iceland. Here he shares findings from recent paper published in the International Journal of Market Research.
Probability-based survey data is often considered the gold standard in the social and health sciences. However, the costs of collecting such data are high and have been increasing over time. Therefore, researchers are looking for alternative sources of data, such as nonprobability online panels. These data are often cheaper and can be collected at a faster pace.
As the prevalence of non-probability panels increases, researchers have explored how comparable they are to data produced by other sources, such as from probability-based online panels. Understanding the comparability of probability and non-probability panels is essential for making informed decisions regarding which type of data to collect and how to analyse it.
Because nonprobability panels rely on self-selection, where any interested person meeting certain criteria can register, they have often been criticised for producing unrepresentative samples. However, in recent years, the field of survey methodology has advanced methods which can correct to some degree potential selection biases.
While the selection bias in nonprobability data has been studied in detail, comparatively little attention has been paid to measurement differences across different types of panels. When combining or comparing data from different sources (such as from different panels), ensuring the comparability of measurement is essential. If measurement equivalence can be established, concepts can be meaningfully compared across groups and data from different sources can be combined. Failing to establish measurement equivalence may be indicative of differences in response behaviour or response styles and adjustments must be made.
In a recent paper published in the International Journal of Market Research, we explored the issue of measurement equivalence in probability and nonprobability panels. We used data from several panels from Australia (an address-based survey and the Australian National University Poll, as well as five nonprobability panels) and Germany (German Internet Panel, the GESIS Panel and eight nonprobability panels) and analysed three multi-item scales in each country. In Australia we explored: willingness to adapt new technology, internet use, and psychological distress; while in Germany we looked at: the Big Five personality scales, the need for cognition scale, and interest in politics.
In our analyses, we examined whether measurement equivalence could be established between data from probability and nonprobability panels, as well as between different panels of each sampling type. To test for measurement equivalence between groups (in this case probability and nonprobability panels or between different nonprobability surveys), we used confirmatory factor analysis (CFA).
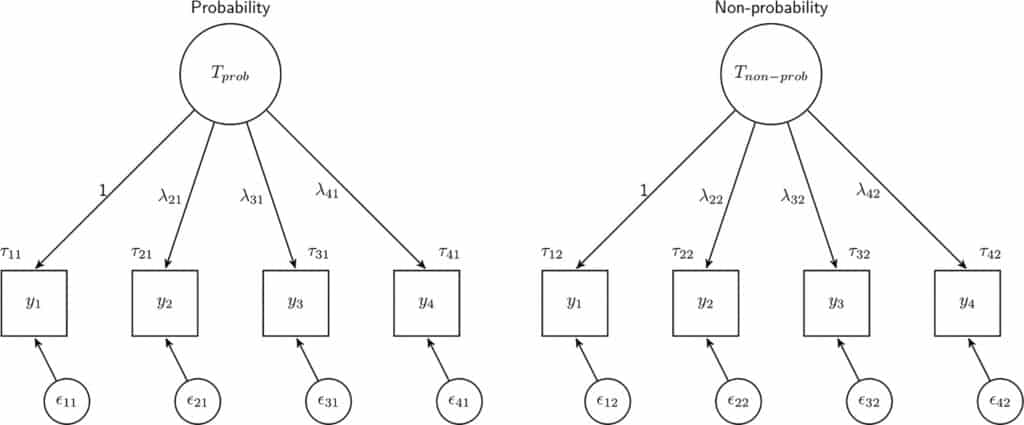
Our results showed that measurement equivalence cannot be guaranteed when combining data from different types of panels or from panels of the same type. When comparing probability and nonprobability panels, we found differences in five (out of 27) coefficients tested across the six scales. The coefficients which were different between sampling types were mostly related to differences in means between the two groups. Similar results were found when nonprobability surveys from the same country were compared, as six (out of 27) coefficients were different, and these were the same coefficients that differed between sampling types (with one additional coefficient in Germany). Finally, measurement equivalence could not be established for probability-based panels in four of the six scales analysed.
In surveys (particularly nonprobability ones), demographic subgroups respond at different rates, which can be adjusted for using weights. Therefore, we repeated our analyses with weights, but this did not improve comparability, as some scales became more similar in their coefficients (bolded), while others became more divergent (italics). Still, there were some interesting trends in the effects of the weights, as the coefficients that diverged tended to be related to variance (loadings and residuals) while the coefficients that became more similar tended to be related to the average of the latent variable (means and intercepts). This may suggest that weighting affects the means of the latent variables but doing so inflates variances. As a result, weighting for demographics fails to consistently improve measurement equivalence.
| Country | Scale | No weights | With weights |
| Australia | New technology | residuals | |
| Internet use | intercepts, residuals | intercepts | |
| Psychological distress | |||
| Germany | Big Five | intercepts, residual | intercepts, means |
| Cognition | Means | means | |
| Politics | Means | means |
| Country | Scale | No weights | With weights |
| Australia | New technology | ||
| Internet use | intercepts, residuals | loadings, intercepts, residuals | |
| Psychological distress | |||
| Germany | Big Five | intercepts, means | intercepts, means, residuals |
| Cognition | Means | means | |
| Politics | Means | residuals |
| Country | Scale | No weights | With weights |
| Australia | New technology | loadings | |
| Internet use | intercepts, means, residuals | loadings, intercepts | |
| Psychological distress | residuals | ||
| Germany | Big Five | Intercepts | intercepts, mean |
| Cognition | Residuals | residuals | |
| Politics | intercepts, means | intercepts |
These results show that full measurement equivalence cannot be guaranteed when combining or comparing data from probability and nonprobability panels or from different panels of each type. Our analyses also showed that the sampling design does not affect all scales, indicating that some topics may be more robust to these differences than others.
What do these findings mean for survey practice? While we can say that there are differences in measurement between nonprobability and probability-based panels, testing for measurement equivalence does not tell us that one source is “better” than the other. However, it does tell us that combining and comparing data from different sources is challenging, in terms of representation and for measurement.
Our most important advice is that when combining data from different sources, measurement equivalence should be investigated. If full measurement equivalence is not identified, partial equivalence can sometimes be established by relaxing parameter restrictions and latent variable scores from multi-group CFA can be used for adjustment.
Read more about this research in our open access paper published in the International Journal of Market Research.
More blog posts
 Social Statistics Research Event, University of Manchester
 Can mental health be compared across ethnic groups? A test of the General Health Questionnaire (GHQ12)
 Understanding the Measurement Quality in Smartphone Usage: Surveys vs. Digital Trace Data
 Interview for Frontmatter podcast discussing survey research and longitudinal data analysis
 Summer schools in applied statistics and survey methodology 2023
- Call for abstracts 4th Mobile Apps and Sensors in Surveys workshop