In recent years mental health has received considerable attention, helping to diminish some of the stigma associated with it as well leading to an increase in the support offered by health services. At the same time ethnic disparities have also been a target of mass moevements and policy interventions. In order to inform these debates scientists need to use tools that can correctly measure mental health across different ethnic groups.
One of the most popular tools for measuring mental health is the General Health Questionnaire (GHQ). The version with 12 questions (GHQ12) is particularly popular in survey data collection due to its ease of implementation and low burden. Although the GHQ12 is extremely popular both in clinical and general population studies there is limited research regarding its quality and comparability across ethnic groups.
| ghqa | Have you recently been able to concentrate on whatever you’re doing? |
| ghqb | Have you recently lost much sleep over worry? |
| ghqc | Have you recently felt that you were playing a useful part in things? |
| ghqd | Have you recently felt capable of making decisions about things? |
| ghqe | Have you recently felt constantly under strain? |
| ghqf | Have you recently felt you couldn’t overcome your difficulties? |
| ghqg | Have you recently been able to enjoy your normal day-to-day activities? |
| ghqh | Have you recently been able to face up to problems? |
| ghqi | Have you recently been feeling unhappy or depressed? |
| ghqj | Have you recently been losing confidence in yourself? |
| ghqk | Have you recently been thinking of yourself as a worthless person? |
| ghql | Have you recently been feeling reasonably happy, all things considered? |
In a recent peer review paper we have explored how best to model the responses coming from this scale and investigated if we can indeed use it to compare ethnic groups in a valid way. We used the Understanding Society dataset which has a large sample of the main ethnic groups in the UK selected using probability sampling procedures.
How to model the GHQ12?
Given its popularity the GHQ12 has been analysed in many different ways. Maybe the most popular approach is to make a simple sum score of the answers to all the questions (after recoding the negatively asked questions). While this approach has the benefit of simplicity it does make some strong assumptions regarding the way the concept is measured. The most problematic one being that the quality of the questions is the same.
An alternative approach is to use models that can estimate the quality of each question and correct for differences in the final score. Latent variable models, like Confirmatory Factor Analysis (CFA), are particularly well suited to do that.
An additional complication is that some questions are positively worded and some are negatively worded. While having both in the scale is useful, as it can deal with some types of measurement errors, like acquiescence and primacy/recency, the quality of negatively worded questions can be markedly different to the positively worded ones. Ideally, this difference should be included in the model.
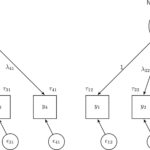
In the CFA framework there are two main ways of doing this. In one, you can include correlated errors for all the negatively worded questions. This approach is called Correlated Trait, Correlated Uniqueness model (CTCU). The other approach is to include a “method” factor that contains the common variance in the negatively worded questions. This is called the Correlated Trait, Correlated Methods model (CTCM).
Alternative modelling of GHQ that corrects for the method effect introduced by the use of negative wording questions.


In our paper we start by investigating which approach is better and if we can improve a model using a single latent factor. The results indicate that the CTCU is the best fitting one model. This implies that the negative worded questions are indeed different from a measurement perspective to the positively worded ones. At the same time, this specific measurement error is not the same across all the negatively worded questions, thus CTCU outperforming the CTCM model.
Is the GHQ12 measured the same way across ethnic groups?
The next step in our analysis was to investigate if the model we have identified is the same across ethnic groups. We did this by dividing the data in different groups and adding restrictions to the coefficients in the model. Our results indicate that GHQ12 does appear to be measured in the same way across ethnic groups.
This means that we can use our models to estimate mental health for each of the ethnic groups in the data. If we use the white British group as the reference it appears that both Indian and African respondents have significantly lower scores on mental health.
| Differences in mental health | Reliability (ω) | |
| White British | Reference | 0.75 |
| Mixed | 0.08 | 0.81 |
| Indian | –0.09 | 0.76 |
| Pakistani | 0.02 | 0.79 |
| Bangladeshi | -0.04 | 0.75 |
| Caribbean | 0.02 | 0.79 |
| African | -0.28 | 0.68 |
We further investigated the reliability, or quality, of GHQ12 for each of the ethnic groups and have found some differences. The results indicate that the GHQ12 has the lowest quality for the African group (0.68) and the highest one for the Mixed group (0.81). That being said, these differences do not appear to bias mean comparisons in mental health.
Conclusion
Overall the paper brings some good news to users of the GHQ12. It appears that mental health scores calculated using this instrument can be used to compare the relative levels of ethnic groups. Nevertheless, the instrument is far from perfect, as highlighted by the use of correlated errors and moderate levels of reliability. As such, I would recommend using latent variable modelling to alleviate at least some of these issues.
If you want to find out more check out our peer-reviewed paper!
More blog posts
 How comparable is the measurement of survey questions in probability and nonprobability panels?
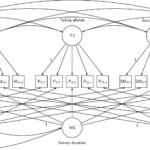 Understanding the Measurement Quality in Smartphone Usage: Surveys vs. Digital Trace Data
 Understanding mode of interview switching in longitudinal surveys
 Understanding Measurement Error from a Total Survey Error perspective
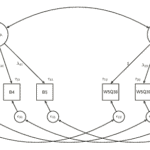 Are web survey answers similar to face to face ones?
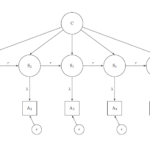 Measurement Error in Longitudinal Data