New forms of data are all the rage in the social sciences. Researchers are exploring data which can replace or complement surveys such as social media or accelerometer data. Part of this trend is the collection of “objective” measures of health. These include athropometric information (like height and weight), physical performance data (like grip strength) and biological biomarkers (like those from the blood).
There are many good reasons why collecting these data and combining them with surveys is a great idea. For example, they bring more detailed information that cannot be measures using self-reports. Also, combining these measures with probability surveys has the potential to bring the best of two worlds: representative samples with a wealth of contextual data and in depth health information.
This is the reason why large surveys are now regularly collecting such data. Examples of surveys that do this are: Health and Retirement Study, English Longitudinal Study of Ageing (ELSA), Survey of Health, Ageing and Retirement in Europe, Understanding Society (US), Health Survey for England and so on. Such data are truly invaluable for the social and health sciences.
That being said, treating such data as the “truth” can be problematic. Many researchers assume that these measures are infallible and that traditional issues such as measurement error are not relevant. In a recent paper we have investigated this claim. Our objective was to analyze how nurses influence anthropometric and physical performance measures collected from respondents in two nationally-representative UK biosocial surveys.
Design of the study
We used two large and high quality probability surveys that also collect biological data: the English Longitudinal Survey of Ageing (waves 2, 4 and 6) and the UK Household Longitudinal Study – Understanding Society (waves 2 and 3: USW2 and BHPSW19). We looked at fourteen anthropometric and physical performance measures covering weight, height, pulse, grip strength, and lung capacity.
| Measure | Units | Name in data |
|---|---|---|
| Height | cm | height |
| Weight | kg | weight |
| Pulse | Beats per minute | pulse |
| Grip strength | Individual readings for non-dominant hand in kg | mmgsn |
| Grip strength | Individual readings for dominant hand in kg | mmgsd |
| Lung capacity | The amount of air that can be blown out in one second, measured in liters | htfev |
| Lung capacity | The speed of air moving out of lungs at the beginning of expiration, measured in liters per second | htpev |
| Lung capacity | The total amount of air that can be forcibly blown out after a full inhalation, measured in liters | htfvc |
We estimated a particular type of measurement error which we call “nurse effects” (based on the eponymous “interviewer effects” from survey methodology). This represents the proportion of variation that is explained by nurses in the measures of interest. If we really would have no measurement error this should be 0%. That would mean that the health measurements are independent of the nurse that collects them. At the other extreme, they could explain 100% of the variation, meaning that it actually does not matter what they measure and from whom they collect the data because the nurse explains all the variation. Typically survey questions have between 0% and 10% interviewer variance (although it can be larger, like we found in our skin color study).
To estimate this type of measurement error we use an established approach from the field of survey methodology that separates variation in three sources: nurses, areas and individual. We also control for individual and nurse characteristics to avoid other possible confounders.
Findings
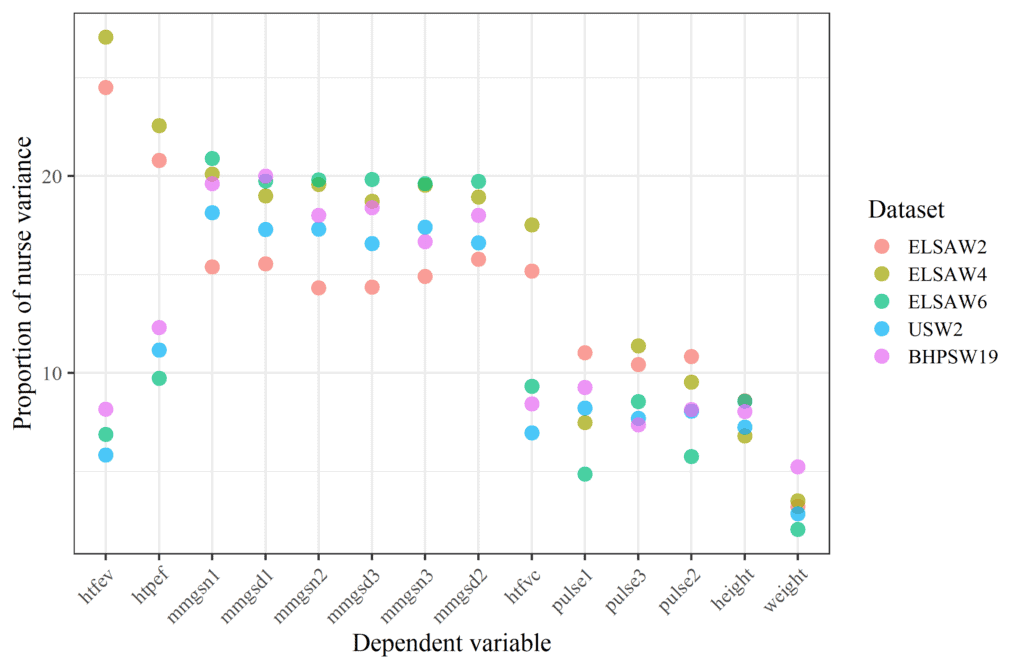
Overall, we find there is a medium effect of nurses on health measures. Across all variables collected in both studies, nurses explain around 13% of the variation. Variation in specific measures range between approximately 2% and 25%. Grip strength and lung capacity are more heavily influenced by nurses than are height, weight, and pulse. Also, nurse characteristics explain only a very small proportion of nurse measurement variation.
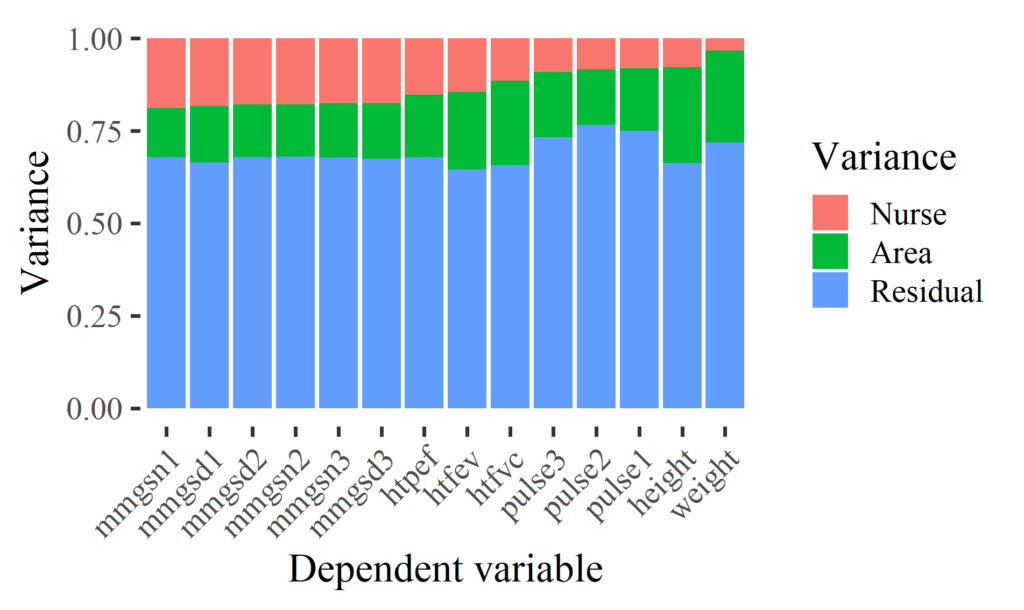
We also investigated variations by data source and wave. The measurement of lung capacity in ELSA waves 2 and 4 seem to be significantly larger compared to the other studies. This could be due to the equipment used in those waves.
Conclusions
Overall, we saw that “objective” health measures collected by nurses in household biosocial surveys are susceptible to non-trivial amounts of measurement variation. We recommend that survey organizations include anonymized Nurse IDs in data releases to allow researchers to account for this unnecessary source of variation. Also, we advise researchers to conduct sensitivity analyses using control variables that account for nurse variation to confirm whether their substantive findings are not influenced by nurse measurement effects.
Want to learn more? Have a look at our peer reviewed paper:
Cernat, A., & Sakshaug, J. (2020). Nurse effects on measurement error in household biosocial surveys. BMC Medical Research Methodology, 20(1), 45. https://doi.org/10.1186/s12874-020-00922-2
More blog posts
 Understanding the Measurement Quality in Smartphone Usage: Surveys vs. Digital Trace Data
 Interview for Frontmatter podcast discussing survey research and longitudinal data analysis
 Estimating non-linear change in time using the multilevel model for change
 Summer schools in applied statistics and survey methodology 2023
 Developing adaptive desgins for longitudinal studies
 Understanding mode of interview switching in longitudinal surveys