One of the most important research topics in the social sciences is discrimination. It has “high impact” and visibility as tackiling this issue is essential for the working of our societies. Social scientist go about understanding discrimination in very different ways, from experimenting with CVs in job applications to the use of vignettes or by comparing outcomes by ethnicity.
Recently I discovered that researchers also use a measure of skin colour that is collected by interviewers in face to face surveys. They use a colour palette (like the one shown here) to rate the skin colour of interviewees. This has the advantage that is closer to the actual mechanism that leads to discrimination (may well be the first thing people notice).

This measure has become quite popular and there are quite a few academic papers that have been using it (mainly in the Americas) to understand discrimination. From a data quality point of view there are a number of potential problems. One of the most obvious ones is: how the interviewers influence the colour rating? Due to their backgrounds they might have a bias and systematically code people either darker or lighter. Together with my co-authors we had a closer look at this problem.
Investigating skin colour in 22 countries using LAPOP
We used the Latin American Public Opinion Project (LAPOP) study that collects data in the Americas. We looked at data from 22 countries that have measures on skin colour and information on interviewers and looked at three questions:
- Is there a systematic impact of the interviewer and skin colour rating?
- How does it vary by country?
- Does this bias substantive results?
We used a statistical method called multilevel modelling (or hierarchical modelling) to separate interviewer, area and country effects. So what did we find?
How do interviewers influence the rating of skin colour?
Firstly, interviewers have a bias in how they code the skin colour of respondents. We found that interviewers explain around 20% of all variation in the measure of skin colour. This is especially concerning because we normally assume this to be absent (i.e., 0%). In addition, the interviewer variation there was also a systematic effect. Darker interviewers tended to rate respondents as darker as well. For each point the interviewers were darker (scale 1 to 11) they would systematically rate respondents darker by around 0.2 points higher. This effect was stronger for indigenous and mestizo respondents (around 0.3).
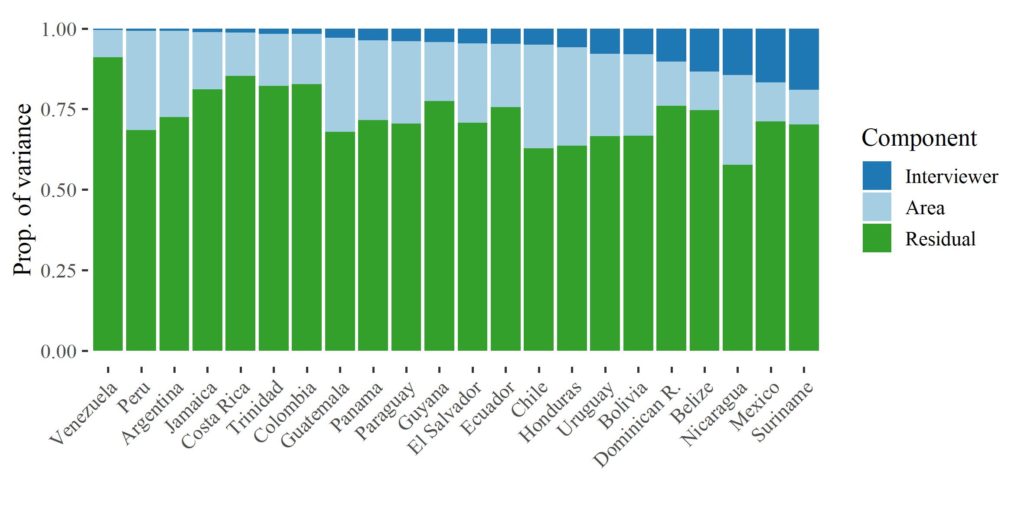
Secondly, we found large variation between countries in this effect. Some countries, like Venezuela and Peru, had low interviewer effects (close to 0%) while others, such as Honduras and Belize, had large effects (closer to 30%). This is important as any country comparisons in discrimination might be biased by differences in interviewer performance.
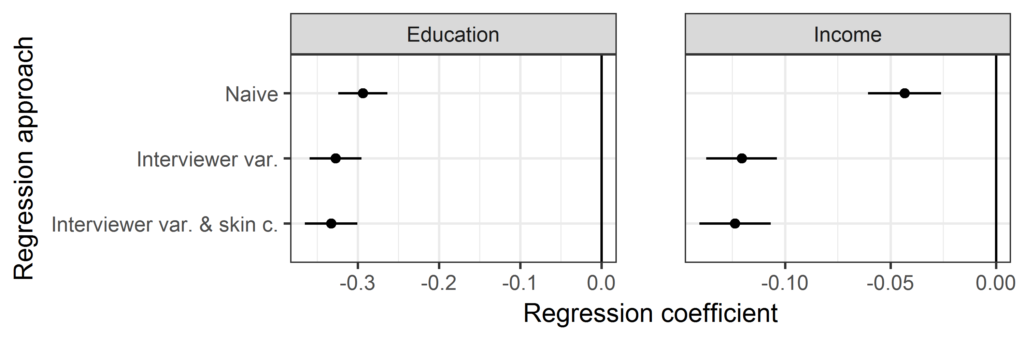
Lastly, we looked at how these interviewer effects can influence substantive results in discrimination research. We made two models, one explaining income and one education. If there is no systematic discrimination effect then skin colour should not have an effect on the likelihood of getting a degree or on income. We did this model in three ways. One we call the naïve approach. This is what most researchers do when they ignore potential measurement issues. Secondly, we did a model in which we controlled for interviewer variation. Lastly, we also controlled for the skin colour of the interviewer (as coded by the supervisor).
What did we find? Overall there are no big differences but it does appear that for discrimination on income we get a stronger effect when we control for interviewer characteristics. For education there is no difference. So this should highlight to substantive researchers the importance of controlling for interviewer characteristics. Also, it should be an indicator for those collecting such data that better care might be needed in collecting this information. Better training and the use of objective measurements is reccomended.
If this sounds interesting and want to know more details you can have a look at our paper that was recently published in the International Journal of Public Opinion Research. The paper is open access and can be accessed here. Any ideas or comments? Write bellow.
More blog posts
 Why do people take longer to do surveys by mobile?
 Are you mixing your survey modes the right way?
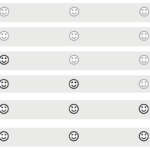 Want to make Web surveys more interesting? Maybe ditch the radio buttons
 Summer schools in applied statistics and survey methodology 2019
 2018 Cathie Marsh memorial lecture: Is there a future for surveys?
 Survey methods deadlines and events: March 2019